


Analytical methods · step-by-step guide
A flat-topped HPLC peak: can you still trust the purity result?
A normal peak should keep an explainable shape. When a flat section appears at the top of the peak, first tell apart whether it is a display issue or whether the signal has already exceeded the range that can be measured reliably.

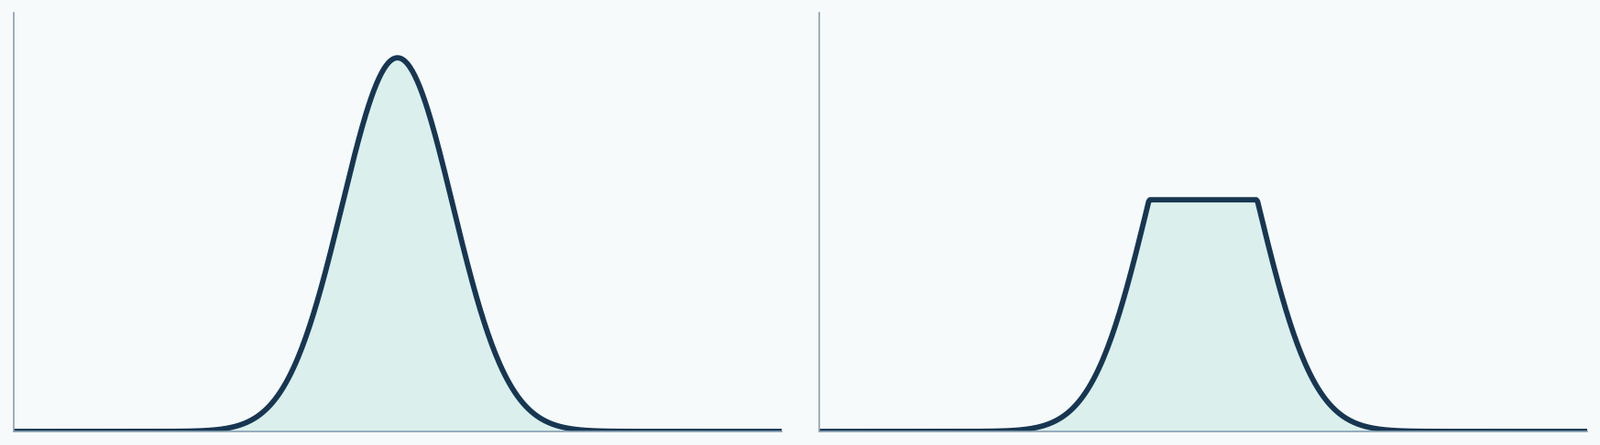
Look at the raw data first, not just the screenshot
If the image is cut off at the top edge of the screen, it may simply be that the vertical-axis display range is too small. If the raw readings themselves continuously stop at the same upper limit, then it is more necessary to check the detector range or the related data processing. Screenshots may look similar, but the reasons behind them may differ.
Original files, instrument prompts, detection settings, and injection records should be kept. A single image of a flattened peak top cannot confirm a specific fault.
A large injection amount affects two different links
If the sample load entering the column is too large, it may change separation and peak shape; if the detector response exceeds its applicable range, the signal may no longer increase with sample amount. Both may be related to injection amount, but they cannot be merged into one cause.
Therefore, retesting should record sample concentration and injection volume. Writing only "halve the injection" is not enough; you must state what was reduced and keep the other conditions comparable.
Use dilution and retesting to see whether the response changes accordingly
Assume the same sample is measured at the original concentration, one-half concentration, and one-quarter concentration, with the same injection volume. Within the applicable linear range of the method, the relevant peak areas should show a reasonable proportional relationship; if the original concentration is outside the range, it may not match.
This is only a troubleshooting approach. A single "allowed deviation" cannot be set for all instruments; the specific range must be determined by method validation and laboratory requirements.
Why does this also affect purity judgment?
Area normalization requires comparing the area of the main peak with those of other peaks. If the main peak signal is pressed against the response upper limit while other small peaks are still recorded normally, the ratios among peaks may be distorted. When separation is poor, multiple components may also be contained under the peak.
Redrawing the integration baseline cannot recover the part of the signal that the instrument did not reliably record. The measurement or separation conditions should be addressed first, and then calculations should be based on suitable data.
Keep this information during retesting
Sample batch number, prepared concentration, injection volume, detector and wavelength, vertical-axis display range, raw peak areas, instrument prompts, and processing method should all be kept. This allows you to determine whether the change comes from dilution, separation, detection, or display.
| Check first | Issue to rule out |
|---|---|
| Adjust the display range and check the raw signal | Is the graph only truncated by the screen? |
| Check the instrument prompts and response range | Has the detector exceeded its applicable range? |
| Record the dilution factor and injection volume, then retest | Are the load and response reasonable? |
| Review the separation and integration method | Are the area ratios explainable? |
Compare peak areas after correcting for dilution
These are deliberately constructed teaching values, not instrument measurements: peak areas of 15000 at full concentration, 10000 at half concentration and 5000 at quarter concentration. Correcting for dilution gives 20000 for both diluted aliquots but only 15000 for the original. The original response is not proportional to the other two and needs investigation.
The table cannot distinguish detector range, loading, matrix effects or processing issues. Keep sample source, injection volume and method comparable, inspect the raw signal, and establish the applicable range before selecting data for integration.
Separate two different meanings of purity
An Agilent OpenLab UV peak-purity check compares spectra across a peak to assess possible co-elution. HPLC area normalization instead calculates selected peak-area proportions. Passing the former does not establish vial content; a high area percentage does not prove a single component under the peak. The official guide flags detector limits and low signal-to-noise as limitations.
| Concentration | Hypothetical peak area | Dilution-corrected area |
|---|---|---|
| Full | 15000 | 15000 |
| Half | 10000 | 20000 |
| Quarter | 5000 | 20000 |
Original sources and further reading
- UV impurity checks and detector response limits
- ICH Q2(R2): validation of analytical procedures · 2024
Sources checked on 2026-10-13. Findings apply to the models and materials studied. Batch quality requires records for the actual batch.