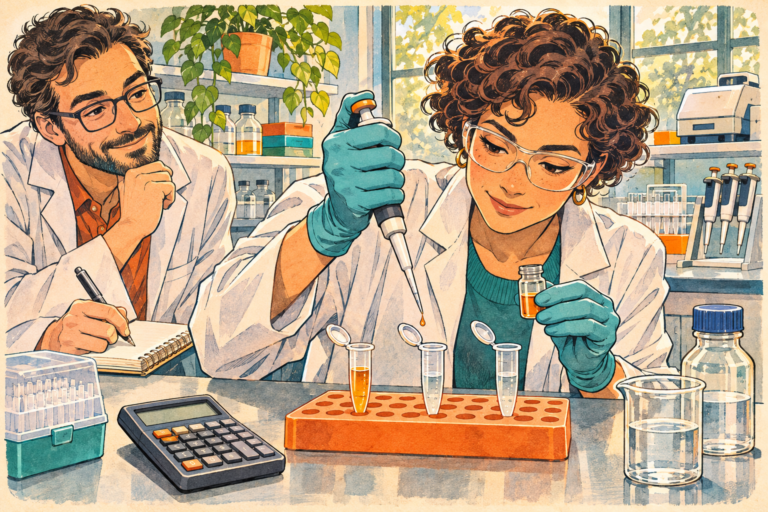
The instrument reads a signal, but what we usually want to know is the concentration. A calibration curve links known concentrations to signals, but a clean straight line does not guarantee that every sample can be plugged in directly.

Start by building a relationship from known quantities
First confirm the identity, assigned value, solvent, and scope of use of the standard material, then prepare calibration points that cover the expected sample concentrations. The curve describes the response under a specific method and set of conditions. Changing the detection wavelength, instrument settings, or sample matrix may all require re-evaluation. Also keep blanks and independent check samples; checking yourself with the same points used to build the curve has limited power to catch problems.
Work through it with a simple equation
Suppose the teaching curve is y=1000x+20, where x is in μg/mL and y is in signal units. If the sample signal is 520, then x=(520−20)÷1000=0.50 μg/mL. Here you subtract the intercept first, then divide by the slope; you cannot simply do 520÷1000. Both the equation and the readings are hypothetical linear teaching models, not detection parameters for glutathione or any other peptide.

Teaching curve and a single dilution back-calculation
- Hypothetical equation: y = 1000x + 20; x: μg/mL
- Measured signal 520: Solution loaded on instrument x = 0.50 μg/mL
- If already diluted 10-fold: Original sample 5.0 μg/mL; check whether the software has already back-calculated
Before calculating a number, check whether it is in range
If the method's evaluated working range is 0.10 to 1.00 μg/mL, then 0.50 is within range; 2.00 is outside it. A computer can calculate a value outside the range, but that does not mean the value is reliable enough. When a sample is outside the range, you can consider a documented dilution whose suitability has been confirmed, then back-calculate to the original sample; when it is below the reliable quantification range, you also cannot report a precise content just because decimal places are displayed.
Use the dilution factor only once, in the right place
Suppose the sample is first diluted 10-fold and measures 0.50 μg/mL; then the original sample, back-calculated according to that dilution relationship, is 5.0 μg/mL. If the reporting software has already done the back-calculation, multiplying by 10 again would be wrong. It is advisable to list "concentration of the solution loaded on the instrument," "dilution factor," and "result for the original sample" separately in the table, and to state clearly how final volume is defined. How much solvent is added when preparing a solution is not necessarily the same as the volume it is made up to.
Even with a high correlation coefficient, what else should you look at
You need to judge in combination with residuals, accuracy and precision at each level, low-end performance, blanks, and check samples. A single high-concentration point may strongly influence the fit; a high R² on a plot may also mask an obvious deviation at the low-concentration end. Whether to use weighting or another model should have a methodological basis, rather than just choosing the setting that maximizes R². ICH Q2(R2) emphasizes that response, accuracy, precision, and so on need to match the intended use. [1]
When reading a report, ask for the information that explains the result
For quantification of glutathione or peptide materials, you can ask about the working range, how the standard material's value was assigned, sample preparation, dilution, and the units of the result. If the purchaser only needs a certain identity check, there is no need to require every method to provide the same kind of curve just to apply the requirements in this article. What is really needed is evidence that matches the question, and records that can be traced from the report to the batch supplied.
Original sources
Check the study conditions and material records separately. Calculations labeled as examples are not batch test results.
 Glutathione