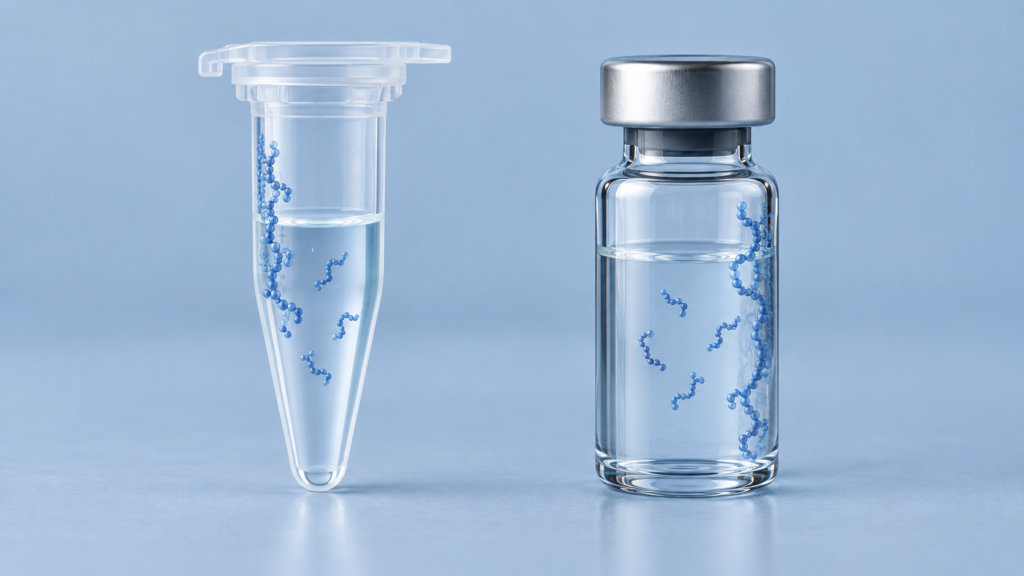
A low peptide signal does not, on its own, show that a peptide degraded. It may reflect an incorrect dilution, loss to a tube or vial surface, a change in the sample matrix, degradation, or carryover and signal effects in the analytical system. The practical question is at which step did the measured amount change? This guide is for laboratory method development and interpretation, not for predicting the behavior of every peptide or any supplied lot.
Short answer
Hold the peptide, matrix, method and nominal concentration constant while changing one contact step at a time. Recalculate the dilution trail, compare paired container materials at defined times, and examine a stability-indicating chromatogram or mass-spectrometric result for new species. An intact-parent peak that falls after contact with a specific container supports a surface-loss hypothesis; it is not conclusive until matrix and instrument effects are controlled. A parent peak that falls while a well-identified degradation product rises supports a different explanation. More than one mechanism can coexist. [1, 2]
Start with an auditable dilution trail
Record the stock concentration basis, each transferred volume, diluent, final volume and unit conversion. Recalculate the expected concentration independently before interpreting the instrument response. If every aliquot from the same freshly prepared dilution is low by a similar factor, investigate the stock assignment and dilution arithmetic first. If fresh and aged aliquots from the same preparation diverge, investigate contact time, container and solution stability. These are diagnostic patterns, not proofs of any single cause.
The serial dilution and plate planner can document the arithmetic and layout. Its calculated concentration is not a measured recovery, and it cannot correct adsorption, degradation or a matrix effect. Confirm pipette performance and any content correction with the laboratory’s own records.
Test the container hypothesis without confusing it with degradation
Create matched aliquots of the same prepared solution in candidate tubes or vials. Keep fill volume, matrix, nominal concentration, cap, handling, temperature and sampling schedule comparable. Include a time-zero measurement made by a validated route and a control for the analytical system. Test the low end of the intended range as well as higher concentrations: a surface can remove a larger fraction of a dilute sample. If feasible, compare the original solution with a deliberately transferred aliquot, because each extra transfer adds a new contact surface. [1, 2]
The container label alone is not a performance guarantee. In a 2022 UPLC–MS study, Zhang and colleagues examined 50 tryptic peptides from bovine serum albumin (BSA), then investigated 12 responsive peptides susceptible to adsorption. For the centrifuge-tube experiment, BSA-digest mixtures at 50, 500 and 5,000 ng/mL expressed as total protein were held in three 1.5 mL tube types at 37 °C, with triplicate measurements through 24 hours. Recovery was the later peptide peak area divided by the time-zero peak area. At the lowest level, the reported mean across the selected peptides was 94.01% in the modified low-binding polypropylene tube, 82.43% in one ordinary polypropylene tube and 76.62% in the other. At the two higher levels, the mean recoveries for the three tube types did not differ significantly in that experiment. These are study conditions and selected-peptide results, not a universal threshold for all peptides or containers. [1]
The same investigators ran a separate autosampler-vial experiment with 200 µL aliquots in low-binding polypropylene, ordinary polypropylene and glass vials at 10 °C, measured at 0, 2, 10 and 24 hours. All 12 selected peptides had reported recovery above 80% at 24 hours in the tested low-binding vials. At the low concentration, only five of the 12 cleared 80% in the tested glass vials, and none cleared 80% in the tested ordinary polypropylene vials. The vial result should not be substituted for the tube result: geometry, contact conditions and performance differed. [1]
A second primary experiment by Kristensen and colleagues used analytical HPLC to study mastoparan X, melittin and magainin 2, three cationic membrane-active peptides, in borosilicate-glass vials, standard polypropylene tubes and Protein LoBind tubes. It found that substantial loss to glass or plastic could occur quickly under its tested buffer and concentration conditions; the authors’ adsorption-kinetics test for mastoparan X included 10-second, 1-hour and 24-hour contact points. Lower concentration and a larger exposed surface relative to solution volume could worsen fractional loss in that system. This does not establish a numerical recovery for unrelated peptide sequences, matrices or NHD materials. [2]
These two full-text studies do not establish that one container material always wins. Their tested peptides, solution matrices, temperatures and analytical endpoints differ. A laboratory should compare candidate surfaces using its own peptide and method. [1, 2]
Look for chemical change with a suitable method
If a sample loses intact-parent signal in multiple validated containers, examine whether the method resolves and identifies plausible degradation products. A declining parent peak alone cannot distinguish degradation from adsorption or altered ionization. Compare fresh and aged samples using a method shown to detect relevant changes, and record pH, solvent, oxygen exposure, light, temperature and time. Do not assign a chemical pathway from a new peak without appropriate identity evidence. The existing storage and shipping evidence guide explains why solution-specific stability needs its own conditions and methods.
Read the pattern, then confirm it
| Observation under controlled comparison | Next check | Limit of the inference |
|---|---|---|
| Fresh samples disagree with the expected concentration by a consistent factor | Recheck stock basis, units, transfer volumes and calibration | A matching arithmetic error is possible; detector or matrix bias can mimic it. |
| Same solution gives different intact-parent signal after exposure to different containers | Repeat with matched time, fill volume and matrix; examine surface contact and extraction controls | Supports a container-associated loss; it does not establish adsorption chemistry by itself. |
| Signal decreases as contact time increases | Compare a fresh aliquot, multiple contact times and degradation-product readouts | Both adsorption and solution instability can be time dependent. |
| Parent falls and identified degradant rises | Verify identity and a suitable mass balance with a stability-indicating method | Product formation supports degradation but does not exclude simultaneous surface loss. |
| Blank after a high sample contains target signal | Investigate autosampler, needle, column and wash conditions | Carryover can create an apparent gain or false positive rather than explain only low recovery. |
In Zhang and colleagues’ system, column and needle conditions affected peptide carryover separately from tube and vial recovery. Their chromatographic optimization should be treated as a method-specific example; changing a mobile phase or wash solvent requires validation against sensitivity, separation and matrix compatibility. [1]
What these studies cannot establish
Both cited papers are analytical-method or laboratory adsorption studies. Neither tests clinical efficacy, human dosing or the identity, purity, content, stability or suitability of an NHD product lot. “Low-binding” describes the tested consumable class; it does not eliminate the need for peptide-specific recovery checks. The 24-hour figures above must stay attached to their stated analytes, materials, matrices, temperature, time points and analytical endpoints. [1, 2]
For a purchasing or quality decision, request the applicable material and lot documentation and match the proposed analytical workflow to the actual peptide form and solution. The analytical methods center and quality documentation hub explain the distinct questions answered by identity, chromatographic purity, content and stability records. Catalog materials discussed on this website are for laboratory research, development and manufacturing use only, not for human or veterinary use.
Primary sources
- Zhang Y, Yang J, Ma Y, Cao L, Huang Q. Nonspecific adsorption evaluation and general minimization strategy in peptide analysis based on ultra-performance liquid chromatography-mass spectrometry. Se Pu. 2022;40(7):616–624. DOI: 10.3724/SP.J.1123.2021.12012. Full text, PMC9404093. PMID 35791600. Article in Chinese; English abstract available.
- Kristensen K, et al. Adsorption of Cationic Peptides to Solid Surfaces of Glass and Plastic. PLOS ONE. 2015;10(5):e0122419. DOI: 10.1371/journal.pone.0122419. Full text, PMC4416745. PMID 25932639.
Sources & editorial method
AI-assisted editorial draft; independent Codex source, image and seven-language review; human professional review not claimed
2 linked records are listed in the references below. Read the editorial and AI-assistance policy.
How to interpret this article
This article summarizes third-party records and does not establish the identity, quality, safety or efficacy of any catalog lot.
Research-use boundary: Catalog materials discussed on this website are for laboratory research, development and manufacturing use only, not for human or veterinary use. This content is not medical advice and does not provide administration instructions.
Primary records and authoritative sources
- Zhang Y, Yang J, Ma Y, Cao L, Huang Q. Nonspecific adsorption evaluation and general minimization strategy in peptide analysis based on ultra-performance liquid chromatography-mass spectrometry. Se Pu. 2022;40(7):616–624Source 1. See primary-source and claim-trail entry in article.md
- Kristensen K, et al. Adsorption of Cationic Peptides to Solid Surfaces of Glass and Plastic. PLOS ONE. 2015;10(5):e0122419.Source 2. See primary-source and claim-trail entry in article.md