Lot-document scope confirmed before quotation · Research use only
  • Specification Review
  • Lot Documents on Request
  • Business Support · Xi’an
  • Destination Eligibility Confirmed
西安诺和达生物科技有限公司

ANALYTICAL METHODS · PRACTICAL GUIDE

Why the Same Peptide Can Have Different HPLC Retention Times

Find out what controls the time at which a peptide peak appears.

NHD Technical Team3 teaching figuresSources checked: 2026-10-11

One report places a peptide peak at 5 minutes; another puts it at 8. Is one wrong? The answer depends on how the tests were run. Retention time belongs to a method as well as a sample.

What is retention time?

Retention time is the time between starting the run and the appearance of a particular peak. It describes how long a component took to pass through the system under those test conditions.

It is useful for comparison when conditions are controlled. It is not a fixed number permanently attached to a product name.
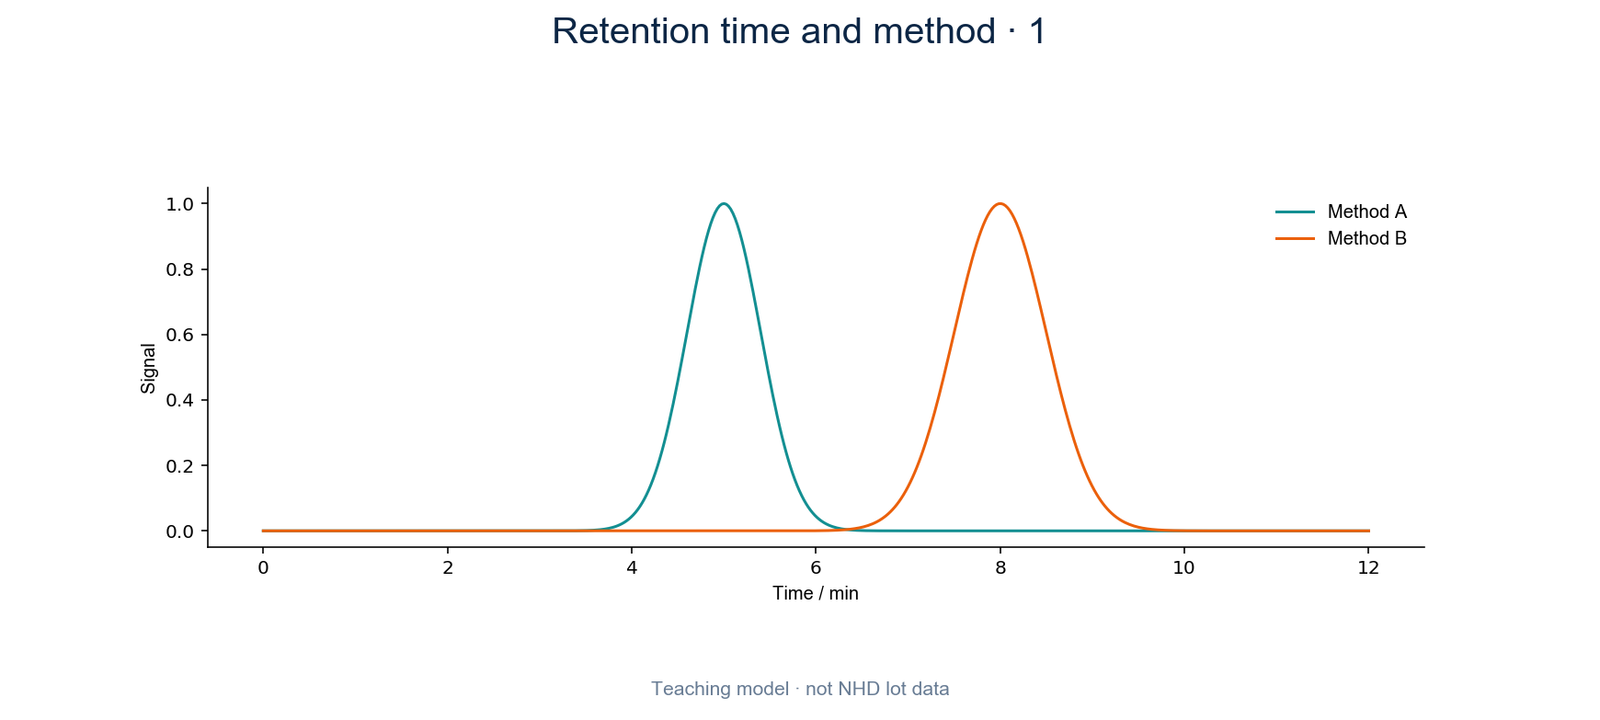
Retention time and method · 1
Figure 1. Retention time is read from the time axis of a chromatogram.

Why a different column can change the time

A column is more than its broad type, such as C18. Dimensions and the material inside can differ. Components may interact with those materials differently, changing how long they remain in the column.

Two reports that both say C18 are therefore not necessarily using the same method.

Solvent and flow also matter

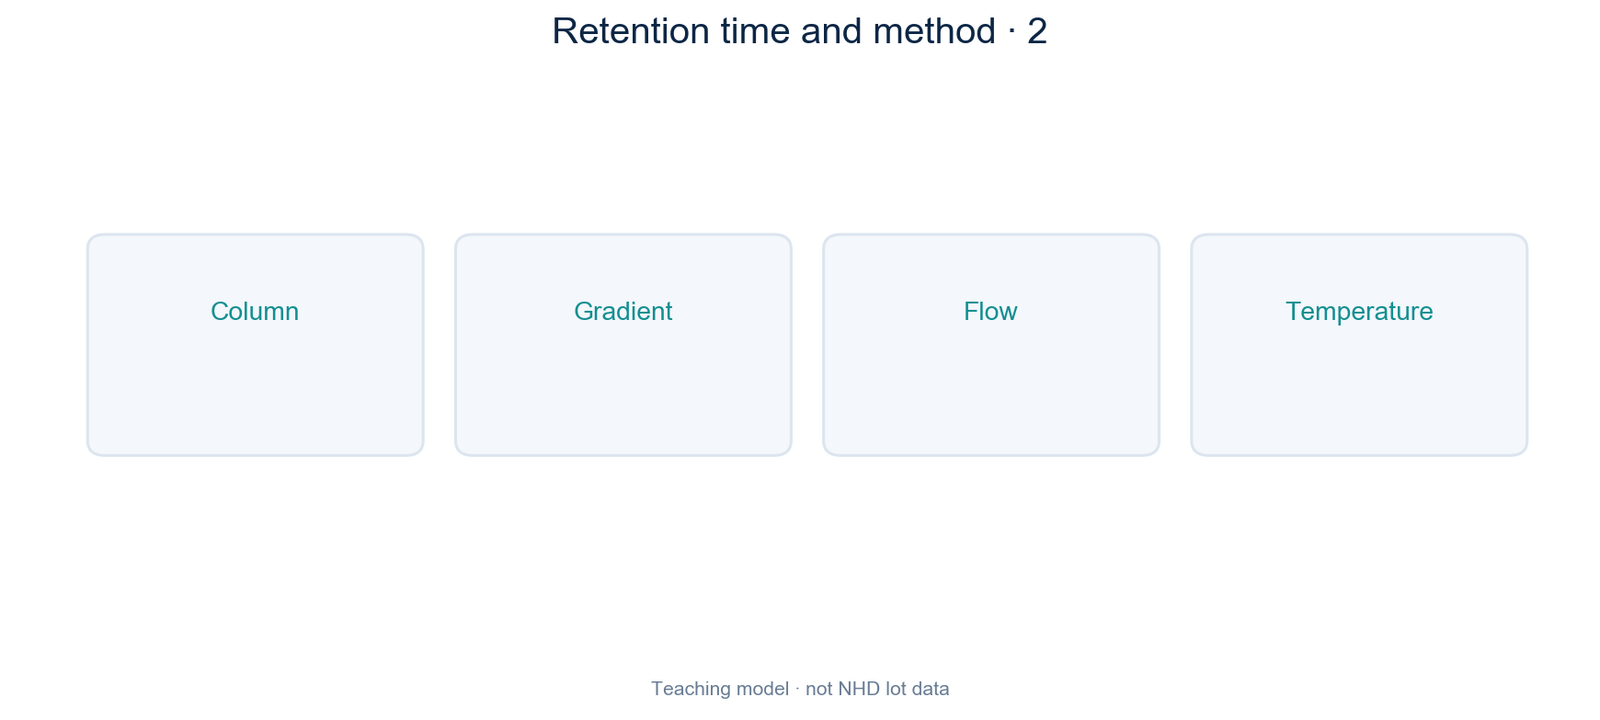
Many peptide methods gradually change the solvent mixture during a run. This is called a gradient. A different starting mixture or a faster change can move peaks. Flow rate and temperature also form part of the comparison.

Read these details before comparing times. Detector settings matter to how the recorded signal is seen, even though they are not a substitute for the separation conditions.
Retention time and method · 2
Figure 2. Different method conditions can move the same component’s peak.

How to make a useful comparison

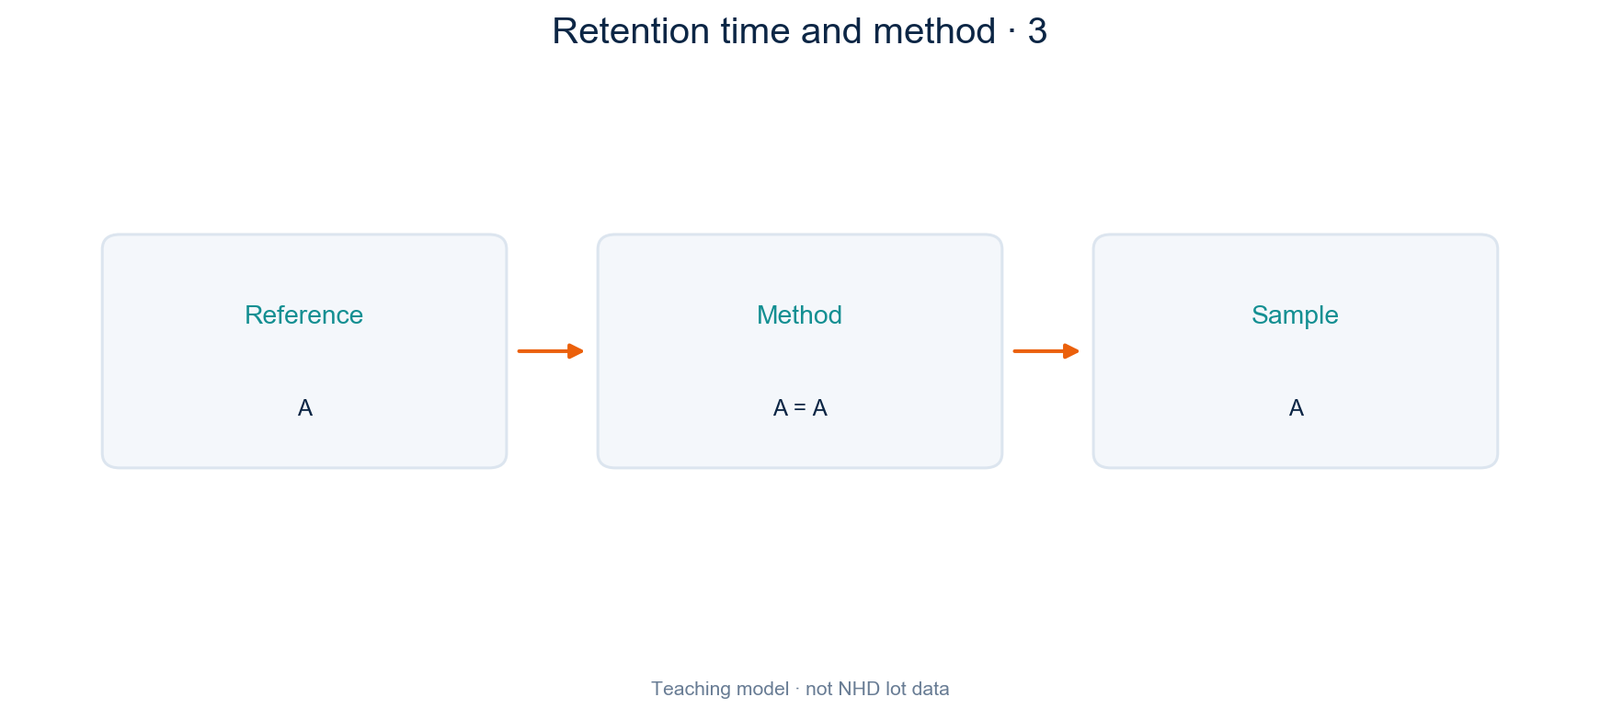
Place the column details, solvent program, flow, temperature and detection settings side by side. If they differ, a time difference alone cannot show that the samples differ.

A suitable reference tested under the same conditions can strengthen the comparison. Even matching retention times do not by themselves prove a complete peptide sequence.
Retention time and method · 3
Figure 3. Compare conditions first, then compare sample signals.

A quick check before you reject a report

A different time is a reason to investigate, rather than an automatic pass or fail. Start with the method information.

Both reports say C18. Can you assume their retention times should match?

See the answer

No. Check the specific columns and the other conditions before making that comparison.

Comparing Cagrilintide or MOTS-c records

When reviewing Cagrilintide or MOTS-c information, ask for the method details that accompany any chromatogram. Keeping those details with the plot makes later comparisons more useful.

Cagrilintide / MOTS-c

Discuss material and document requirements with NHD · Continue with the analytical guide

Can Column Temperature Separate Overlapping Peptide Peaks?

See how temperature can change chromatographic selectivity, and why a clearer peak does not automatically mean a purer sample.

Can Column Temperature Separate Overlapping Peptide Peaks?
Editorial illustration, not an experimental photograph.

Separation needs more than an earlier retention time

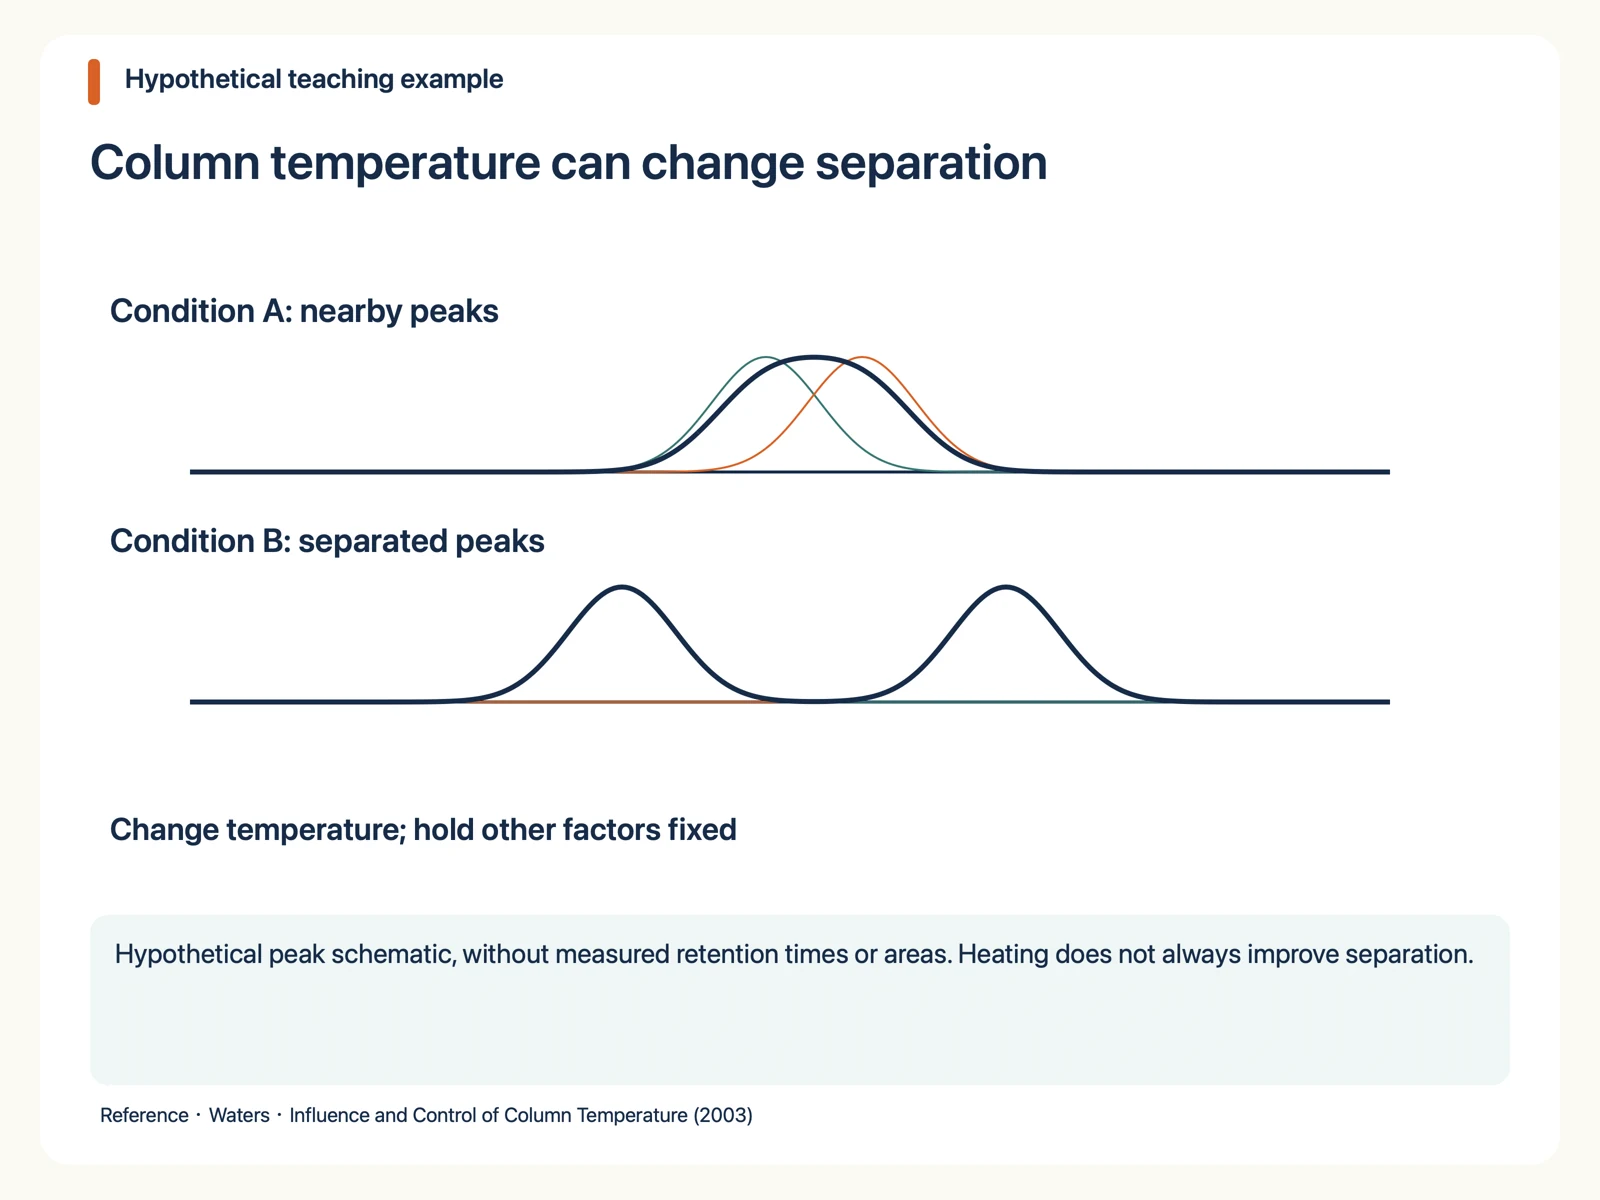
Separation depends on peak spacing and width. Moving every peak earlier does not necessarily improve separation. A useful change may occur when two components move by different amounts. Selectivity describes their relative retention, rather than simply how fast the run finishes.

Temperature can affect different peptides differently

Temperature changes mobile-phase properties and interactions with the stationary phase. It can bring components closer together or farther apart. Waters discusses temperature control of both retention and selectivity in peptide mapping. This is not a general rule that hotter always means better.

Column temperature can change separation
Hypothetical peak schematic, without measured retention times or areas. Heating does not always improve separation.

Read the hypothetical peak diagram

Condition A has nearby components whose combined signal resembles a broad peak. Condition B shows greater spacing. Thin curves represent explanatory component signals; the thick curve represents their sum. No measured retention times, areas or validated resolution values are claimed.

Change one factor before assigning a cause

To investigate temperature, keep other relevant conditions comparable and record column, mobile phases, gradient, flow, injection amount and integration rules. Changing several factors prevents attribution to temperature alone. Stay within the applicable limits for the specific column and material.

Compare methods before comparing purity percentages

A new method can separate a shoulder and change the main-peak area percentage without the sample itself changing. Use a method appropriate to the question and comparable conditions across batches. Selecting whichever chromatogram gives the largest percentage does not establish quality.

Make the analytical enquiry useful

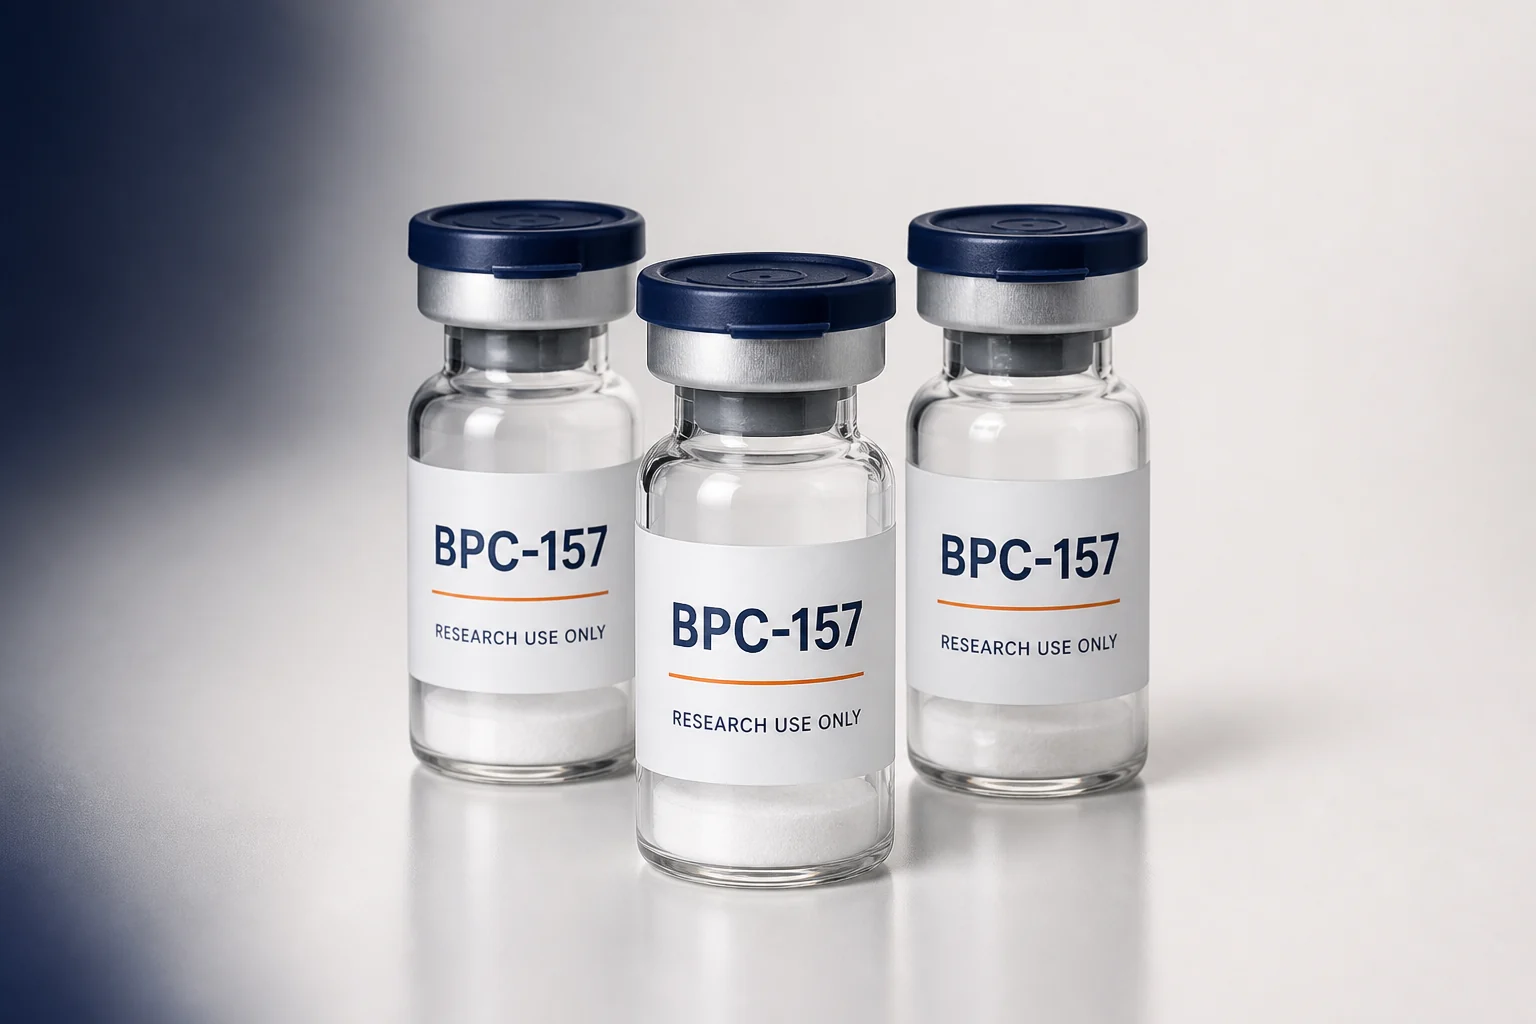
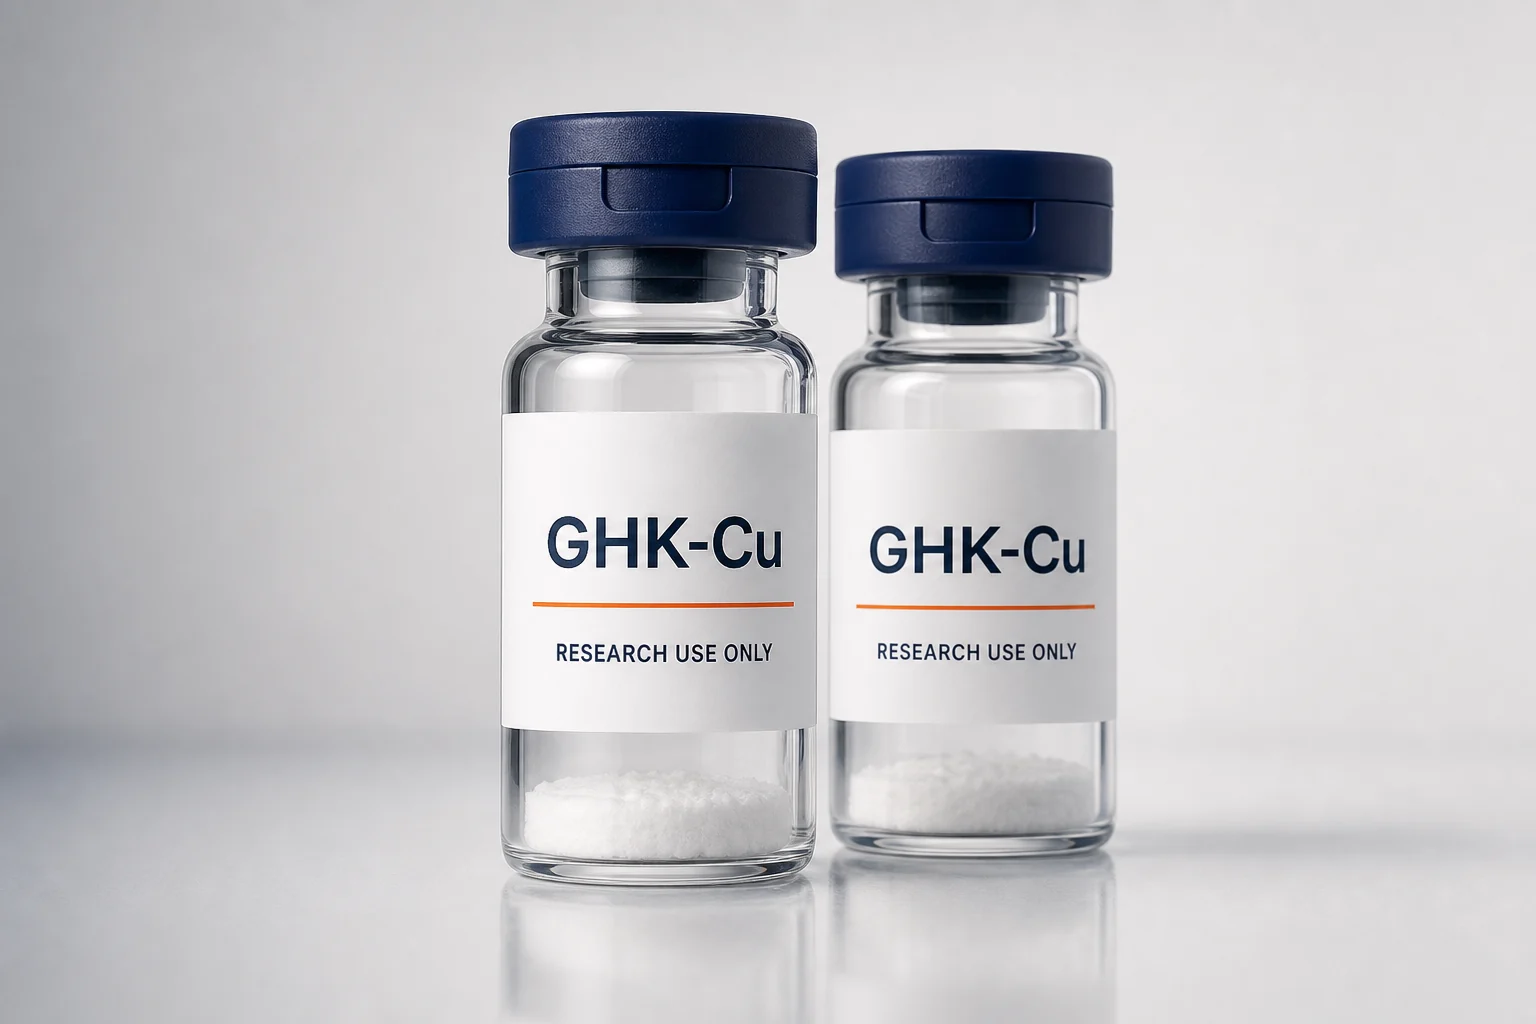
For BPC-157 or GHK-Cu, describe the closely related components you need to distinguish and ask about method suitability. A product name and one purity value cannot replace chromatographic conditions or demonstrate complete impurity separation.

References

Published findings, hypothetical teaching examples and material information are distinguished. Read the original methods before attempting replication.

Related research materials

Enquire about products and information →

Research reading and material enquiries only. This page is not personal medical advice or a substitute for batch-specific records.