


The printed HPLC area percentage depends on which signals were integrated. Integration means deciding where a peak begins and ends and measuring its area. A report should make that process understandable.
The denominator matters
Area purity usually compares the assigned target-peak area with the included total area. Excluding some signals changes that denominator. Some exclusions may be justified by the method, such as a recognized non-sample feature; others need investigation.
A teaching calculation
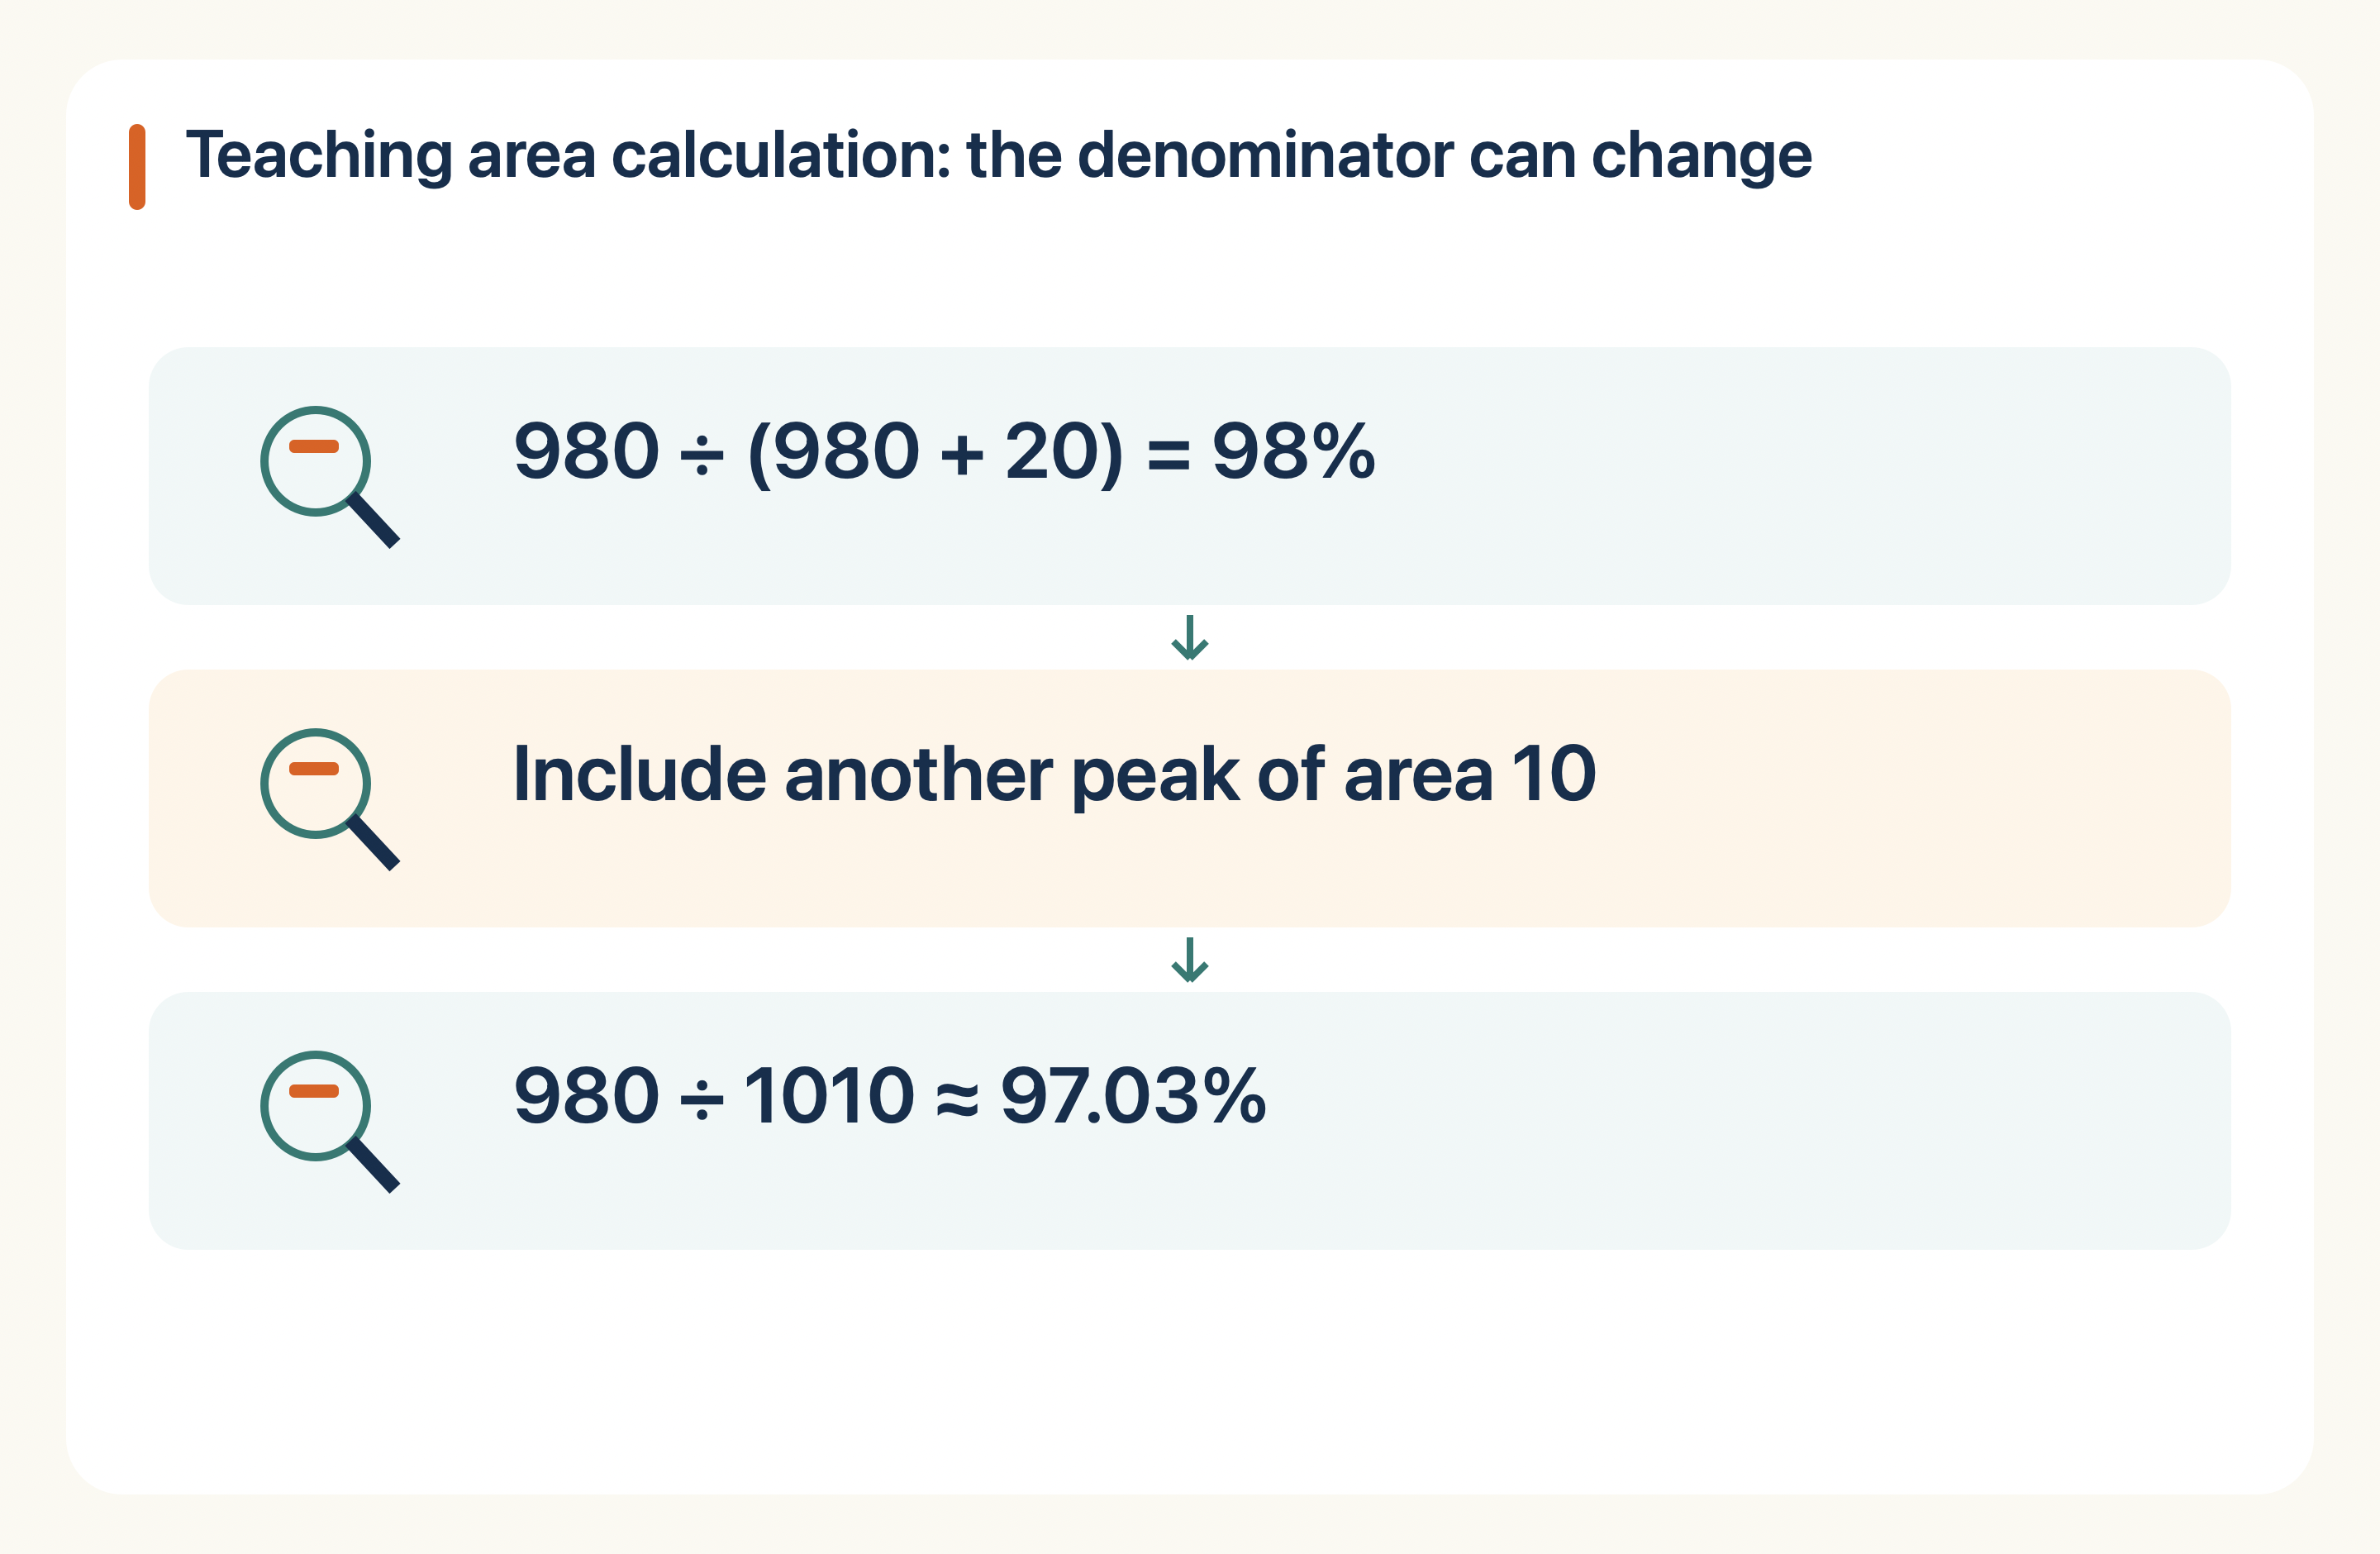
Suppose the target area is 950 units, a counted impurity is 30 and smaller sample peaks total 20. Counting all of them gives 950 ÷ 1,000 = 95%. Excluding the smaller sample peaks gives 950 ÷ 980, or about 96.9%. The material did not change; the accounting changed. These are hypothetical areas, not measured mass fractions.
Ask about the integration method
Request the chromatogram, integration settings and any excluded peaks. A defensible procedure should be suitable for the intended measurement, rather than adjusted simply to produce a larger purity number. Different detectors or wavelengths may also change relative responses.
Use the result within its scope
The reported area fraction does not quantify all possible non-detected material in the powder. Read it alongside identity and content evidence. If comparing suppliers, a similar purity number is a starting point for method review, not proof that the impurity profiles are identical.
Related materials and next steps
Explore the NHD catalogue records for GHK-Cu, LL-37. Confirm the required molecular form, quantity and lot-document availability before relying on a listing for procurement. A catalogue record does not establish equivalence to a published study material.
Send the product or sequence, quantity and document requirements. For more background, browse the analytical methods guides and research glossary.
Sources and reading scope
Source links checked 5 October 2026. Research summaries use the accessible original abstract unless a full-text source is explicitly identified. Guidance documents and external supplier explanations are technical references, not NHD batch evidence or a claim of regulatory compliance. Any example introduced as hypothetical or teaching is a calculation, not a measured product result.
NHD catalogue materials are for qualified laboratory research, development and manufacturing enquiries. This article does not provide instructions for human or veterinary use.
Sources & editorial method
AI-assisted writing and source checks; conceptual illustrated cover.
1 linked records are listed in the references below. Read the editorial and AI-assistance policy.
How to interpret this article
Study results and labeled examples are separated. Original-source, arithmetic, readability and internal-link checks; no independent human peer review recorded.
Research-use boundary: Catalog materials discussed on this website are for laboratory research, development and manufacturing use only, not for human or veterinary use. This content is not medical advice and does not provide administration instructions.
Primary records and authoritative sources
- ICH Q2(R2) Validation of Analytical ProceduresICH Q2(R2) Validation of Analytical Procedures
Continue with structured records
Move from this editorial analysis to the product identity, filtered evidence and controlled terminology behind it.



 BPC-157
 LL-37