“99% pure by HPLC” is one of the most misunderstood phrases in peptide documentation. In the usual area-normalization context, it means that the main peak contributed about 99% of the integrated detector response among peaks counted by that chromatographic method. It does not mean that 99% of the powder mass is the target peptide.
This distinction follows a basic analytical rule reflected in ICH Q2(R2) and ICH Q14: a procedure must be understood in relation to its intended purpose. A chromatographic impurity profile and a quantitative assay can use similar equipment while answering different questions.
What HPLC area percentage actually measures
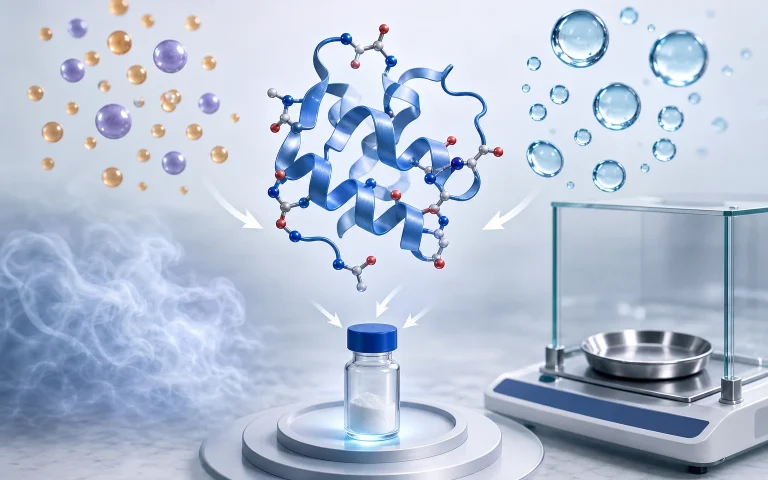
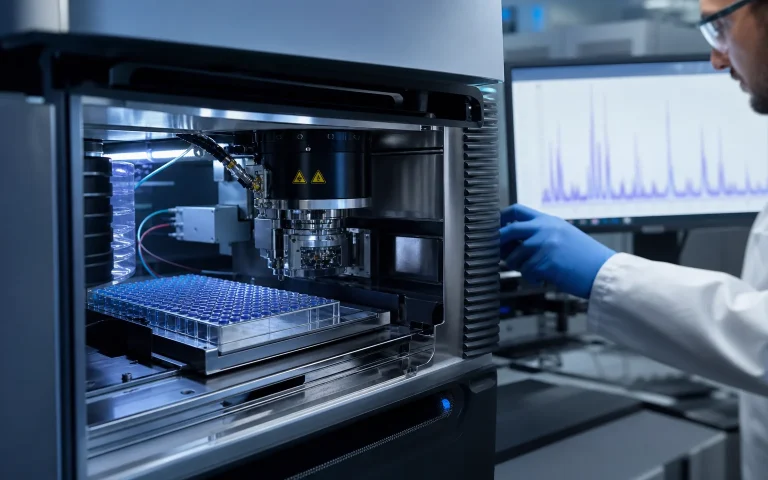
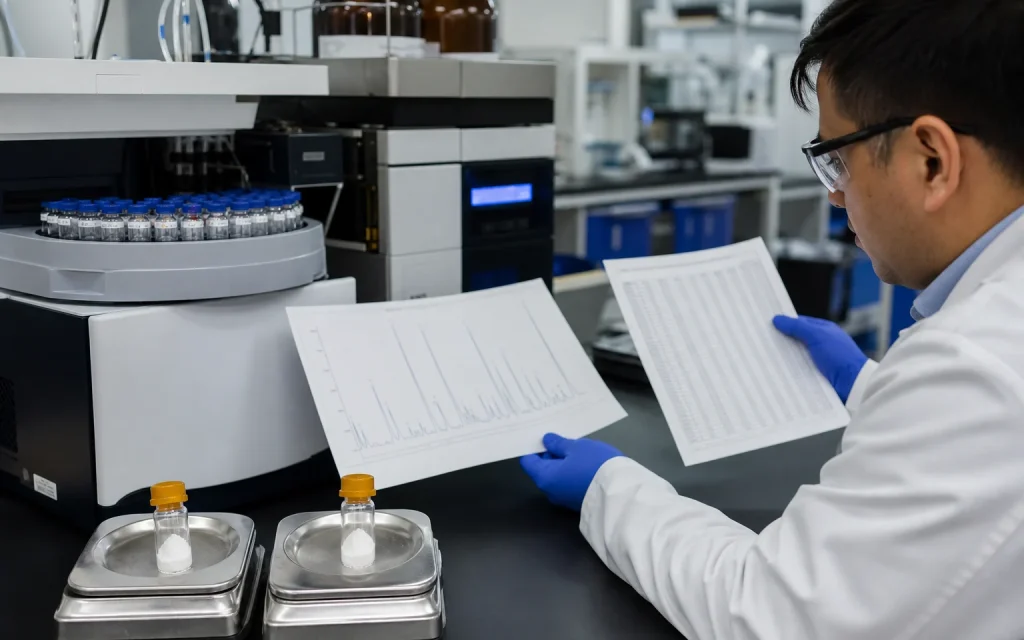
In a typical UV chromatogram, software integrates selected peaks. The main-peak area is divided by the total included area. That ratio depends on the detector wavelength, sample preparation, column, gradient, integration settings and which compounds produce a response. A component that does not absorb at the selected wavelength may contribute mass without appearing as a comparable peak.
Water, many inorganic salts and some counterion contributions are obvious examples. Even among UV-active compounds, equal mass does not guarantee equal detector response. Co-elution can combine components into one peak; an impurity below the reporting threshold can be excluded; a very early solvent front may be ignored. Therefore, area normalization is a useful chromatographic profile—not a universal gravimetric assay.
Purity, assay and content are separate quantities
| Reported value | Question answered | What it does not establish alone |
|---|---|---|
| HPLC main-peak area % | How dominant is the main detected peak under this method? | Target mass fraction, identity, water or counterion amount |
| Assay | How much analyte is present relative to an appropriate standard and stated basis? | Every impurity identity or full sequence |
| Water / volatile content | How much specified non-analyte mass is present? | Chromatographic purity or peptide identity |
| Counterion result | How much acetate, TFA or other ion was measured? | Total target content unless combined with the rest of the composition |
A transparent hypothetical calculation
Suppose—not as a real lot result—that a powder is reported as 99.2% HPLC main-peak area. Separate measurements find 6.0% water and 8.0% counterion by mass. It would be wrong to label the powder “99.2% peptide content.” Even before accounting for other residues, the non-peptide mass already changes the possible net content.
The exact calculation depends on how the assay is defined: as-is basis, anhydrous basis, counterion-corrected basis, free-peptide equivalent or another specification. The certificate should name that basis. Otherwise, two mathematically correct numbers can appear contradictory when they are simply normalized differently.
Why reference standards and response factors matter
A quantitative assay needs a suitable reference and a controlled relationship between signal and amount. Identity or purity of the reference, preparation accuracy, calibration model and matrix effects contribute to uncertainty. The validation characteristics relevant to the method may include specificity, accuracy, precision, range and robustness. Listing “HPLC” does not by itself show that those characteristics were established for a quantitative content claim.
Questions to ask when the headline says 99%
- Is 99% a main-peak area result, a calibrated assay, or a specification limit?
- Which detector, wavelength and integration rules were used?
- Were closely eluting peptide-related impurities adequately resolved?
- Is the result reported as-is or corrected for water and counterions?
- What reference standard and calculation formula support the assay?
- Do water, counterion, residual-solvent and inorganic-residue results complete the mass-balance picture?
How to write the claim accurately
If the available evidence is only a chromatogram, the defensible wording is “main-peak area by the stated HPLC method,” accompanied by the method, batch and result. “Peptide content” should be reserved for a quantitative result whose basis is stated. “Purity” should be qualified so readers know whether it is chromatographic, chemical or another defined measure.
This precise language is not pedantry. It prevents a method from being asked to prove an attribute it was never designed to measure, and it makes different suppliers or lots meaningfully comparable.
Sources & editorial method
The editorial workflow starts with linked regulatory guidance and peer-reviewed analytical-method records; extracts scope, definitions, required fields and limitations; and separates general method principles from product- and lot-specific claims. AI-assisted drafting was used to structure the first version. Claims, examples and boundaries were checked against the linked records in the site editorial workflow. This is not independent peer review or evidence that any catalog lot has passed the tests described.
4 linked records are listed in the references below. Read the editorial and AI-assistance policy.
How to interpret this article
The numerical examples are transparent calculations, not test results for a catalog material. Only a validated lot-specific method and record can establish actual content.
Research-use boundary: Catalog materials discussed on this website are for laboratory research, development and manufacturing use only, not for human or veterinary use. This content is not medical advice and does not provide administration instructions.
Primary records and authoritative sources
- ICH Q2(R2): Validation of Analytical ProceduresDefines validation characteristics and distinguishes quantitative analytical purposes.
- ICH Q14: Analytical Procedure DevelopmentOfficial analytical-development framework; included as general method guidance only.
- Analytical Procedures and Methods Validation for Drugs and BiologicsU.S. Food and Drug Administration. Guidance for Industry, July 2015.
- FDA: ANDAs for Certain Highly Purified Synthetic Peptide Drug ProductsDiscusses peptide-related impurities and why robust analytical characterization matters.
Continue the documentation review
Each guide answers a different analytical question. Use the complete set before treating one number as a complete quality record.
Open the complete Quality & Documentation Hub