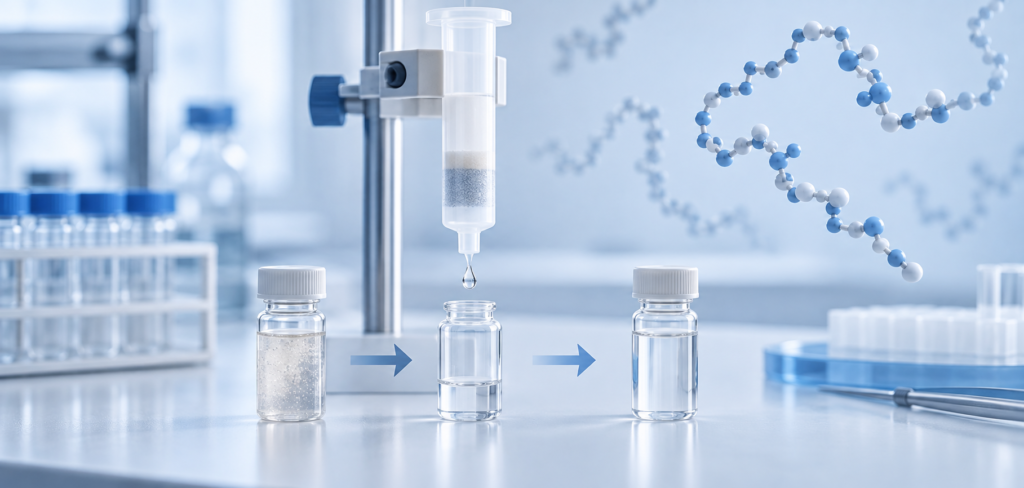
Detergents and polymers can disrupt LC–MS analysis, so sample cleanup is often necessary. Yet a cleanup step can also lose peptides or change which sequences remain detectable. The right question is not simply whether a contaminant is removed, but whether the chosen method preserves the peptides needed at the actual input mass and contaminant load.
A low-input study shows a sharp boundary
A 2023 study benchmarked a magnetic-bead single-pot solid-phase-enhanced peptide preparation method (SP2) against ethyl-acetate extraction for sodium dodecyl sulfate (SDS) and assessed SP2 for polyethylene glycol (PEG). The model sample was an Arabidopsis thaliana tryptic digest, not a purified synthetic peptide lot. The investigators examined peptide inputs of 10 ng, 250 ng and 10 µg and defined SDS or PEG contamination levels. [1, Abstract and Results]
At 10 ng peptide input, SP2 cleanup of a sample with 0.1% SDS lost 3.5% of identified peptides versus the study control and reduced the mean summed peptide intensity by 2.4%. At the same input with 1% SDS, it lost 73.6% of identified peptides and reduced mean summed intensity by 44.7%. These are identification and MS-intensity metrics, not gravimetric mass-recovery percentages. They reveal a method boundary for this low-input matrix, instrument and contaminant combination. [1, §2.5, Figure 10 and Table S2]
| 10 ng Arabidopsis peptide digest after SP2 | Identified-peptide change versus control | Mean summed MS-intensity change |
|---|---|---|
| 0.1% SDS contamination | −3.5% | −2.4% |
| 1% SDS contamination | −73.6% | −44.7% |
The same paper reports that, for 250 ng input challenged with a combined 5% SDS and 1% PEG, SP2 lost 2.9% of identified peptides while summed intensity increased 7.6% versus control. That does not contradict the 10 ng failure: starting amount and contaminant conditions differ. An intensity increase can reflect reduced interference, and cannot be read as more peptide mass after cleanup. [1, §2.4]
A cleanup qualification plan
Use the actual peptide amount, matrix and expected contaminant range. Compare a no-cleanup control where instrument compatibility allows, and include a known peptide mixture or isotope standard at a defined point in the workflow. Track at least three outcomes: residual contaminant/interference, number of peptides identified, and quantitative response for target peptides. Examine retention-time and hydrophobicity patterns, because preferential loss may be hidden by a stable total peptide count. Record whether the standard was added before or after cleanup; only an early spike can report loss in that step.
If a method looks excellent at microgram input, repeat at the nanogram level before using it for scarce samples. A cleanup method may be suitable for broad discovery work yet unsuitable for a targeted peptide whose recovery is poor. The LC–MS peptide identity guide helps confirm which peaks are true targets; the quality documentation hub explains why a method result does not establish a lot-specific release claim.
An independent SDS-assisted proteomics study used potassium dodecyl sulfate precipitation followed by C18 SPE and reported approximately 80% peptide recovery for 20 µg of standard peptides under its tested conditions. That outcome is a different method, input and endpoint than the 10-ng SP2 identification counts above. It supplies a comparator for method design, not a pooled recovery percentage or proof that precipitation is superior at low input. [2, Figure 1B]
Cleanup go/no-go record
List the intended input amount and contaminant concentration, the peptide classes that must remain detectable, the internal-standard addition point, the residual-contaminant assay and a predeclared allowable loss for each critical target. Compare these outcomes after cleanup: target recovery, sequence coverage/identification count, peak shape and matrix suppression. A method passes only for its stated purpose and range; “clean chromatogram” is insufficient if required targets disappear.
Evidence limit
This is plant-digest method evidence. It does not validate SDS/PEG cleanup for all peptide chemistries, clinical matrices, research-material lots or instruments. The figures should prompt a local input-by-contaminant experiment, not a universal acceptance threshold.
Primary source and claim trail
- Benchmarking of Two Peptide Clean-Up Protocols: SP2 and Ethyl Acetate Extraction for Sodium Dodecyl Sulfate or Polyethylene Glycol Removal from Plant Samples before LC-MS/MS. International Journal of Molecular Sciences. 2023. DOI 10.3390/ijms242417347, PMID 38139176. Locations: Abstract (study matrix, inputs, overall comparison); Results §2.4 (250 ng combined contamination and 2.9%/7.6%); §2.5, Figure 10 and Table S2 (10 ng, 0.1% versus 1% SDS and 3.5%/73.6% identification losses, 2.4%/44.7% intensity losses). Primary full-text XML checked.
- A Simple Sodium Dodecyl Sulfate-assisted Sample Preparation Method for LC-MS-based Proteomics Applications. Analytical Chemistry. 2012. DOI 10.1021/ac203394r, PMID 22339560. Location: Figure 1B and adjacent Results text (approximately 80% recovery after KDS precipitation and C18 SPE of 20 µg standard peptides). Independent primary experiment; different endpoint and input from [1].
Sources & editorial method
AI-assisted editorial draft; independent Codex source, image and seven-language review; human professional review not claimed
2 linked records are listed in the references below. Read the editorial and AI-assistance policy.
How to interpret this article
This article summarizes third-party records and does not establish the identity, quality, safety or efficacy of any catalog lot.
Research-use boundary: Catalog materials discussed on this website are for laboratory research, development and manufacturing use only, not for human or veterinary use. This content is not medical advice and does not provide administration instructions.
Primary records and authoritative sources
- Benchmarking of Two Peptide Clean-Up Protocols: SP2 and Ethyl Acetate Extraction for Sodium Dodecyl Sulfate or Polyethylene Glycol Removal from Plant Samples before LC-MS/MSSource 1. Abstract (study matrix, inputs, overall comparison); Results §2.4 (250 ng combined contamination and 2.9%/7.6%); §2.5, Figure 10 and Table S2 (10 ng, 0.1% versus 1% SDS and 3.5%/73.6% identification losses, 2.4%/44.7% in
- A Simple Sodium Dodecyl Sulfate-assisted Sample Preparation Method for LC-MS-based Proteomics ApplicationsSource 2. Figure 1B and adjacent Results text (approximately 80% recovery after KDS precipitation and C18 SPE of 20 µg standard peptides). Independent primary experiment; different endpoint and input from [1].