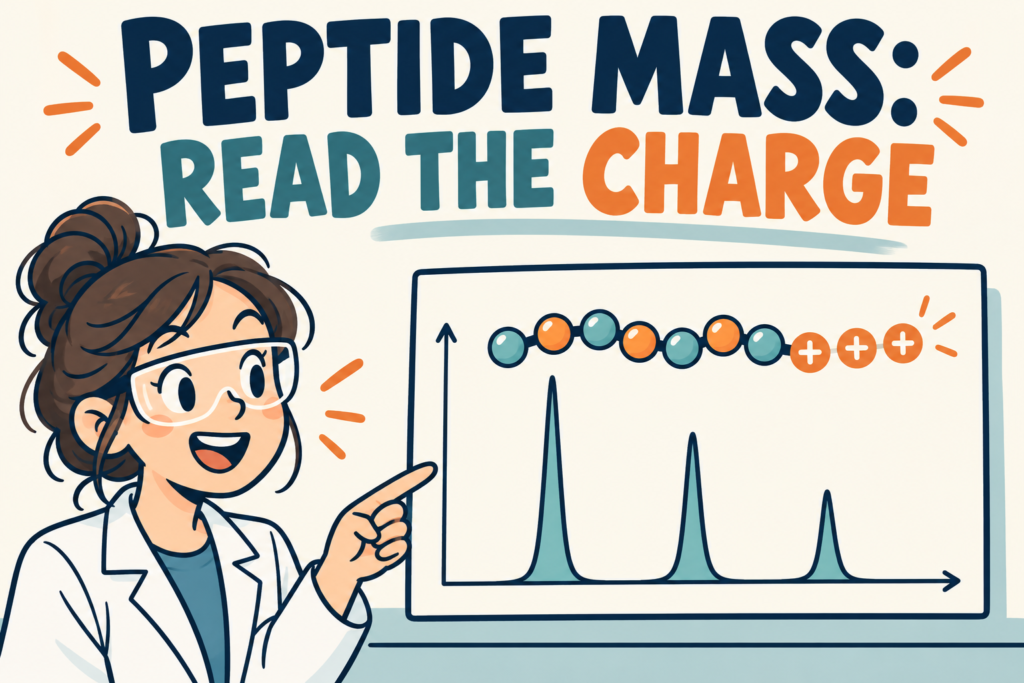
Your peptide document lists a molecular mass near 2,000 Da, but the spectrum has a peak near 1,001. Has the supplier sent the wrong material? That number alone cannot answer the question. A mass spectrometer measures mass divided by charge, usually written as m/z.
One molecule can carry more than one charge
Think of the instrument’s number as a divided value. In positive electrospray, a peptide can pick up more than one proton. Two charges divide the ion’s mass by two; three divide it by three. Thermo Fisher’s introduction explains why mass spectrometry reports mass-to-charge values rather than a simple weight.
A worked example: 2,000 Da becomes about 1,001 m/z
Take an imaginary peptide with a neutral mass of 2,000 Da. For proton-only positive ions, use m/z = (M + z × 1.0073) ÷ z, where M is neutral mass and z is charge. The approximate proton mass is 1.0073 Da. At charge +1, the result is 2,001.0073; at +2, it is 1,001.0073; at +3, it is 667.6739.
These are calculated teaching values, not NHD test results. They describe three charge states of the same hypothetical molecule. The smaller number does not mean the peptide chain has broken in half.
Ask which number the report is showing
Check the charge assignment and whether the report gives raw m/z or a reconstructed neutral mass. Also ask whether it uses monoisotopic mass or average mass. Those are different ways of summarizing isotopes. Sodium adducts, other ion forms and fragments need different interpretation; the simple proton-only formula does not cover them.
A mass match is useful, but it is not the whole quality check
A matching mass supports the proposed identity. It does not, by itself, prove sequence order, purity or the amount of peptide in the powder. Use the mass result alongside the agreed analytical records. Our LC–MS identity guide explains that distinction.
Buying a catalog material such as LL-37, or requesting a custom sequence? Send NHD the exact material and ask which identity records are available. Confirm the scope before ordering; this example does not establish any supplied lot’s identity.
For laboratory research only. Not for human or veterinary use.
References
- Thermo Fisher: Overview of mass spectrometry
- Thermo Fisher: Charge assignment of isotopically resolved mass data
Sources & editorial method
AI-assisted writing, source checks and illustrated cover.
2 linked records are listed in the references below. Read the editorial and AI-assistance policy.
How to interpret this article
Examples are calculations, not NHD lot results. Confirm project feasibility and document availability.
Research-use boundary: Catalog materials discussed on this website are for laboratory research, development and manufacturing use only, not for human or veterinary use. This content is not medical advice and does not provide administration instructions.
Primary records and authoritative sources
- Thermo Fisher: Overview of mass spectrometryTechnical reference; numerical planning examples are original calculations.
- Thermo Fisher: Charge assignment of isotopically resolved mass dataTechnical reference; numerical planning examples are original calculations.