


ANALYTICAL METHODS · PRACTICAL GUIDE
A Peptide Calibration Curve: Calculate an Unknown Concentration
Build the connection between a known concentration and an instrument signal.
The instrument gives a signal of 6.2, but you need a concentration. How can one become the other? Measure known concentrations first. Their signals provide a calibration curve that you can use for an unknown sample under suitable conditions.
Start with samples whose concentrations you know
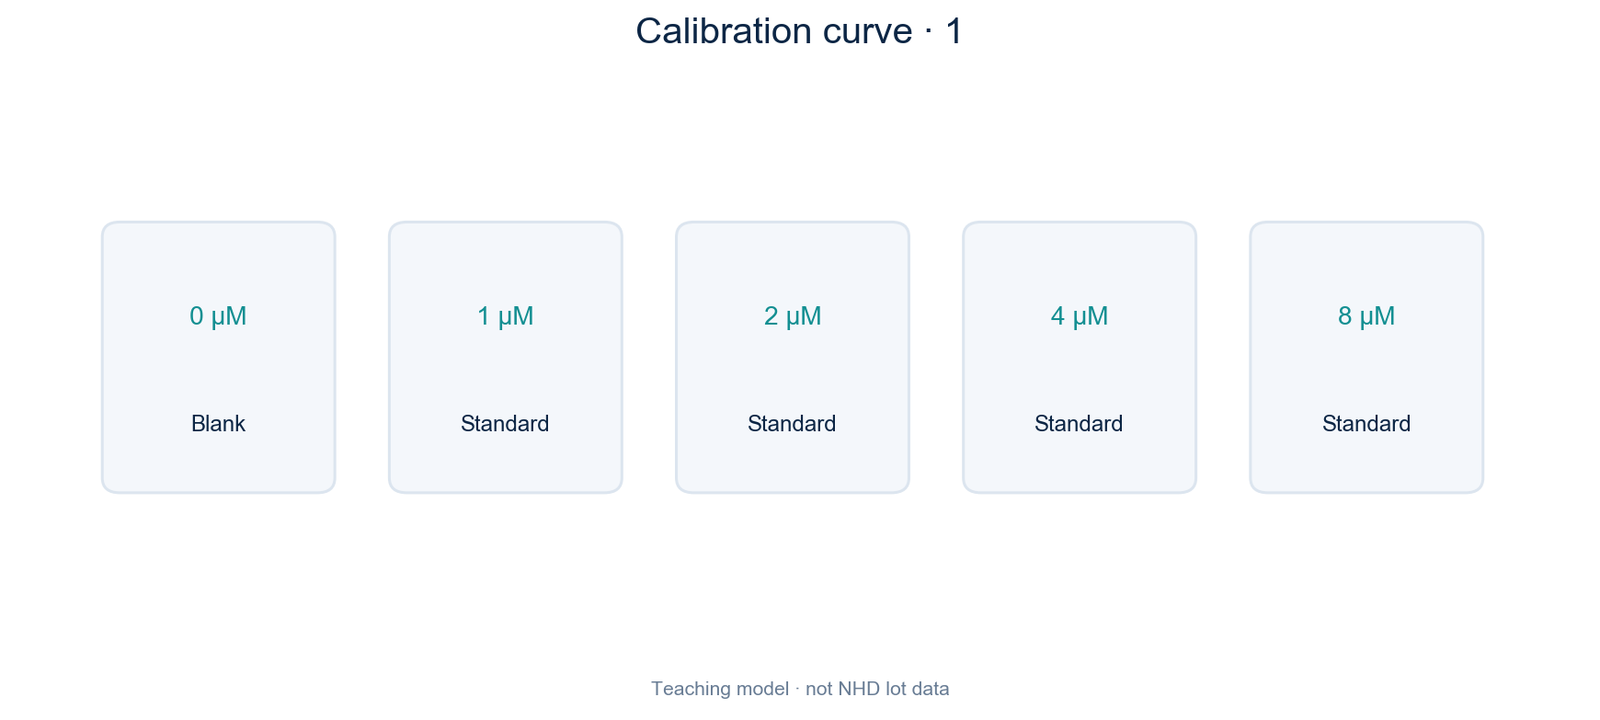
Our teaching standards are 0, 1, 2, 4 and 8 µM. Measure them using the chosen method, then plot concentration on the horizontal axis and signal on the vertical axis.
The concentrations must be reliable. A curve made from incorrectly prepared standards can look neat while giving incorrect results. Standards and unknowns also need suitably comparable preparation and measurement conditions.
What does y = 2x + 0.2 mean?
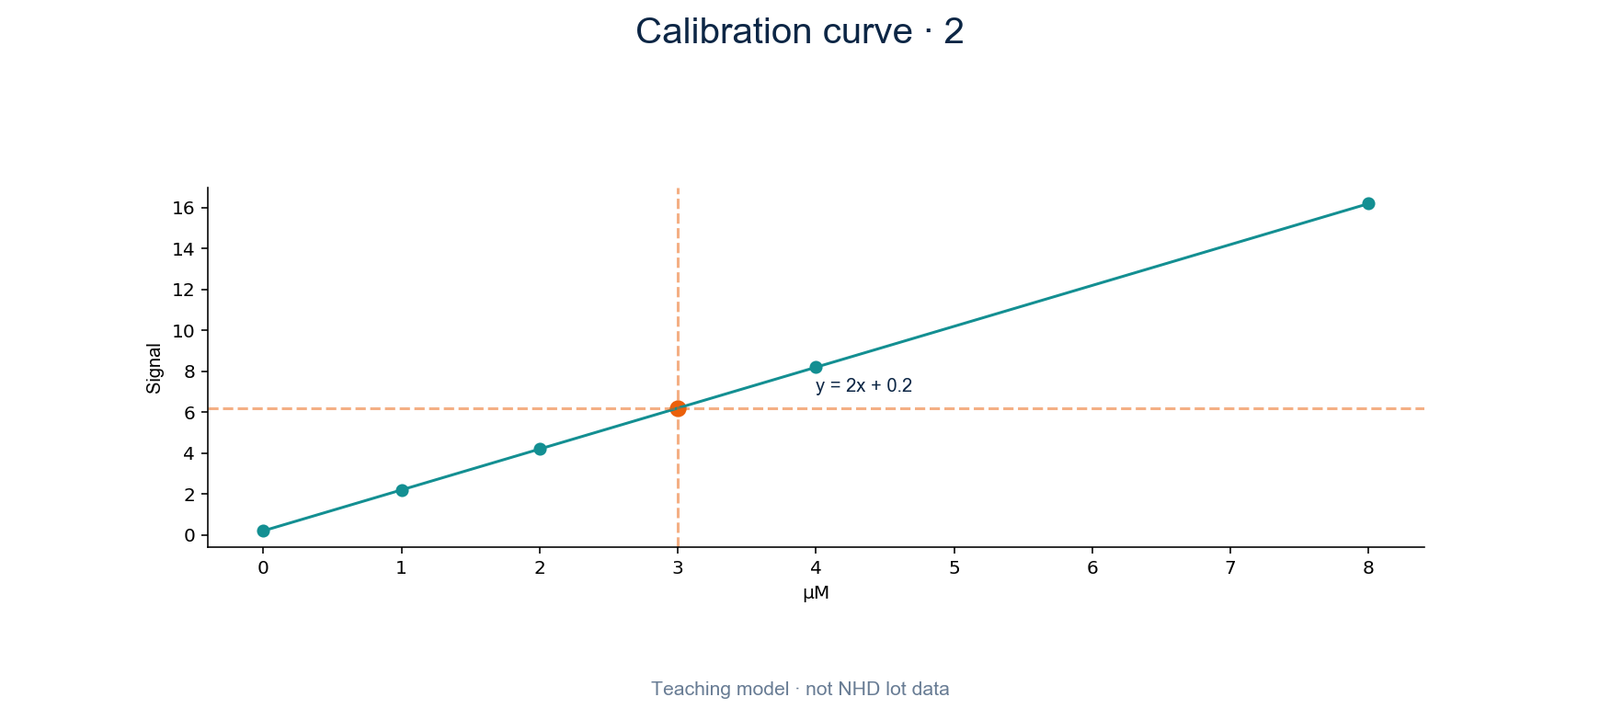
Suppose the fitted relationship is y = 2x + 0.2. Here x is concentration in µM, and y is the instrument response in example units. Each extra µM adds two response units; the intercept is 0.2.
To find x from a signal, reverse the calculation: subtract 0.2, then divide by two. Follow the method’s blank correction; do not subtract the same background twice.
Use the unknown signal
For y = 6.2, x = (6.2 − 0.2) ÷ 2 = 3 µM. This lies within the illustrated 0–8 µM span.
If the unknown is outside the method’s established working range, do not assume the line remains valid indefinitely. The laboratory may need a suitable dilution or another validated measurement arrangement.
Was the original sample diluted?
If the sample was diluted fivefold before measurement, the measured solution is 3 µM, while the original is 3 × 5 = 15 µM, assuming no loss.
One part sample plus four parts diluent gives five parts in total: a fivefold dilution, not fourfold. Record the final volume and transferred sample volume.

A straight-looking line still needs checking
Not necessarily. A high R² describes fit to the data; it does not alone prove accurate low-concentration results. Repeatability, background, recovery and interference also need appropriate checks.
See the answer
The measured solution is (10.2 − 0.2) ÷ 2 = 5 µM. The original is 5 × 3 = 15 µM.
Planning a KPV or LL-37 measurement
For KPV or LL-37 quantitation, explain whether you need a target-peptide amount result or a suitable reference material for a method. A catalog product is not automatically a certified reference standard.
Discuss material and document requirements with NHD · Continue with the analytical guide