Lot-document scope confirmed before quotation · Research use only
  • Specification Review
  • Lot Documents on Request
  • Business Support · Xi’an
  • Destination Eligibility Confirmed
西安诺和达生物科技有限公司

ANALYTICAL METHODS · PRACTICAL GUIDE

Extra Mass-Spectrum Peaks: Sodium and Potassium Adducts Explained

An extra peak may be another ion of the same molecule. Learn what an adduct is.

NHD Technical Team3 teaching figuresSources checked: 2026-10-11

A mass spectrum has a second peak about 22 units above the first. Has the peptide gained an impurity? One possible explanation is a sodium adduct: the same molecule has formed a different ion. We will use a simple example to see the difference.

The instrument detects ions

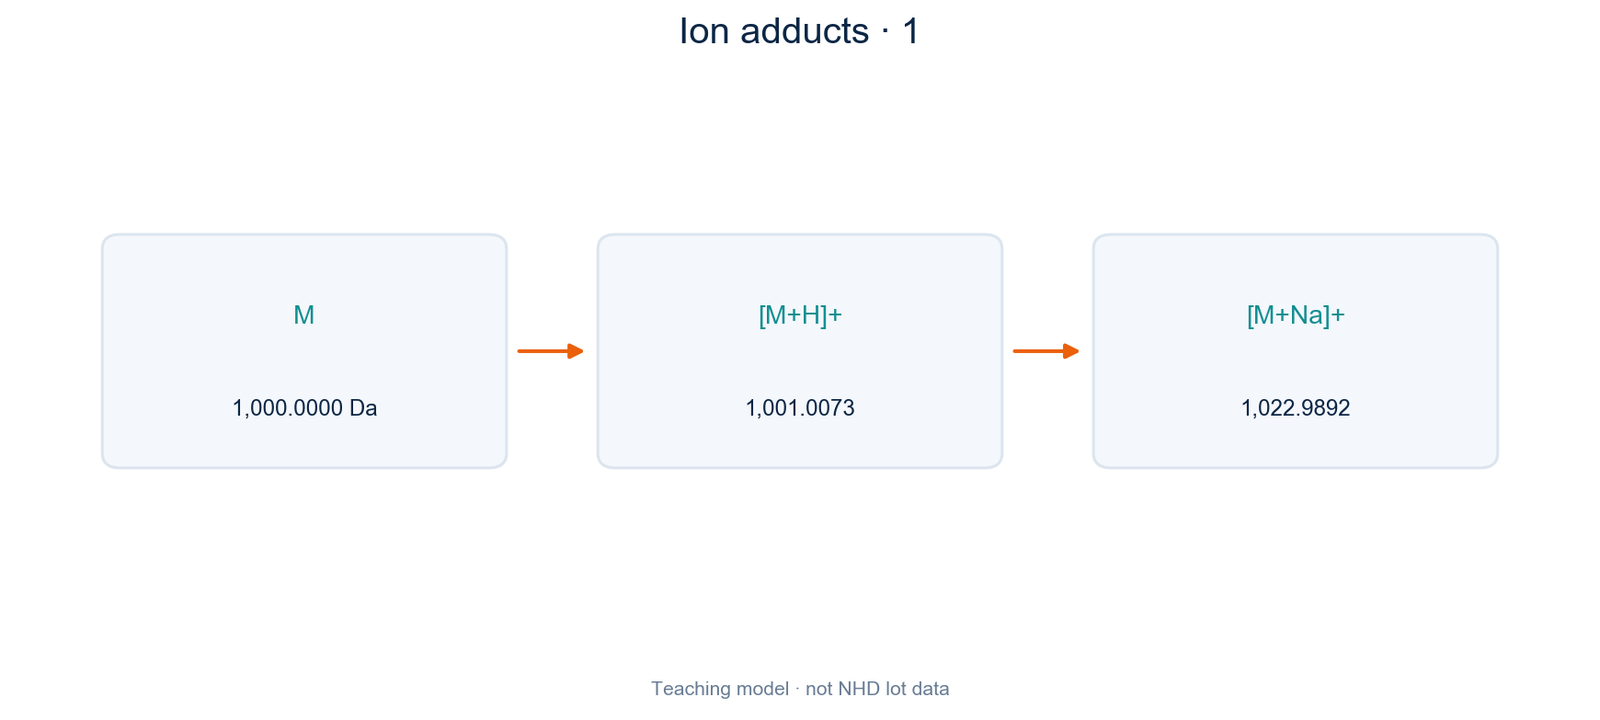
In a positive-ion spectrum, a molecule may form an ion by gaining a proton. We write that as [M+H]+, where M represents the neutral molecule. It may also form [M+Na]+ or [M+K]+ with sodium or potassium.

These signals can represent different ions of the same molecule, rather than three different peptide sequences.
Ion adducts · 1
Figure 1. One molecule can form proton, sodium and potassium adduct ions.

Calculate three single-charge signals

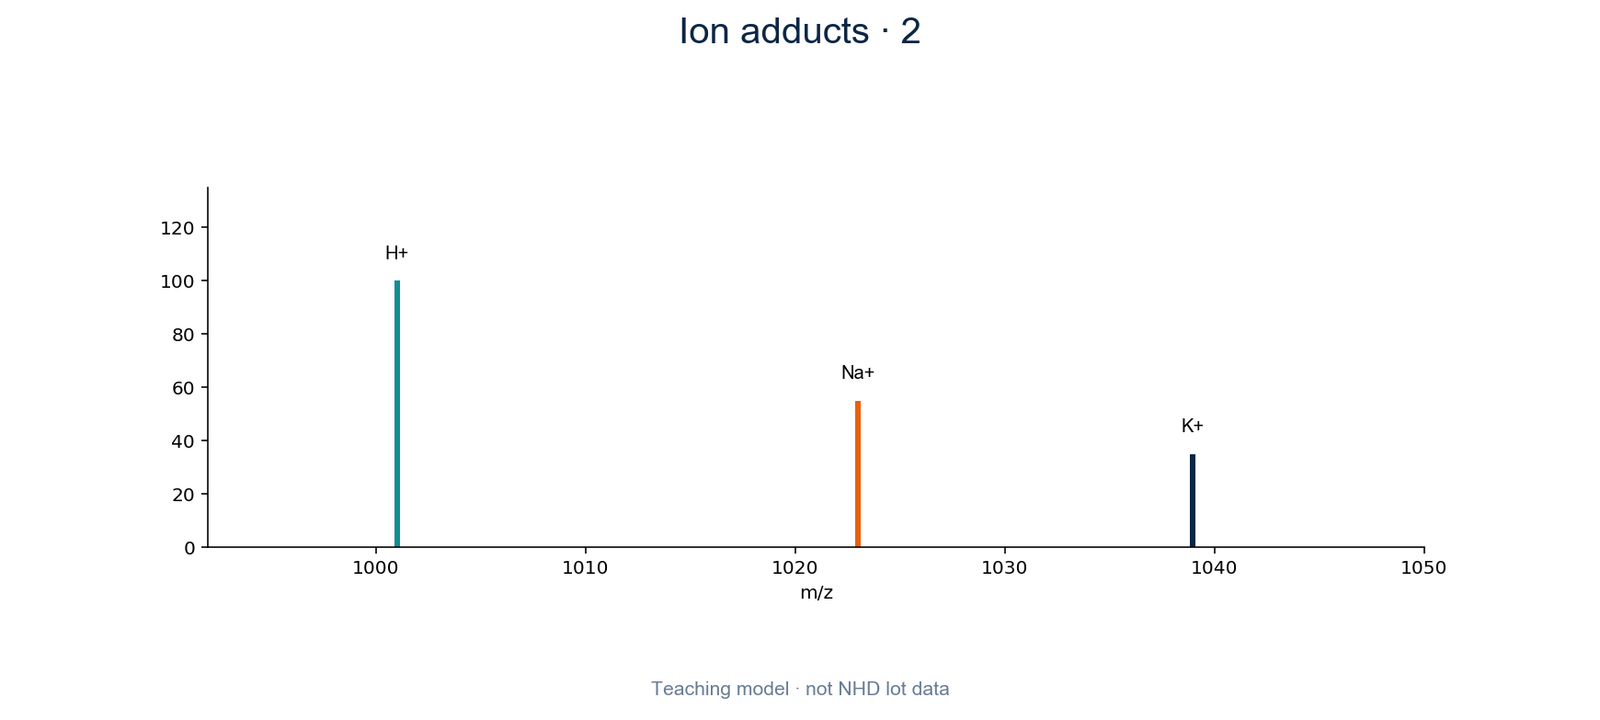
For a teaching neutral mass of 1,000.0000 Da, the approximate m/z values are 1,001.0073 for [M+H]+, 1,022.9892 for [M+Na]+ and 1,038.9632 for [M+K]+.

The sodium signal is about 21.9819 above the proton signal. The potassium signal is about 37.9559 above it. Each difference compares two matching single-charge ions.
Ion adducts · 2
Figure 2. Example single-charge adduct positions for a 1,000 Da molecule.

Why charge changes the apparent gap

The horizontal axis is m/z: mass divided by charge. If sodium replaces one proton in otherwise matching double-charge ions, the gap is about 21.9819 ÷ 2 = 10.9910 m/z.

Before using an expected gap, check the charge and the actual ion formulas. Do not compare unrelated peaks simply because their spacing looks familiar.

A plausible gap is a clue, not a final answer

Check the full pattern, isotope clusters and the chromatographic region in which the signals occur. Background signals or another molecule can complicate the picture.

Adding the heights of these ions does not give an HPLC purity percentage. They are different measurements.

Ion adducts · 3
Figure 3. Use charge and the surrounding signals to investigate an extra peak.

Check the charge before calculating

A useful report names the proposed ions instead of leaving the reader to guess from peak spacing alone.

For matching double-charge ions, what gap follows one sodium-for-proton replacement?

See the answer

About 10.9910 m/z. This calculation assumes that specific replacement and a charge of two.

Reading KPV or MOTS-c spectra

For KPV or MOTS-c spectra, ask which peaks were assigned to the target molecule and which adducts were considered. An extra peak needs an explanation, but it is not automatically a new impurity.

KPV / MOTS-c

Discuss material and document requirements with NHD · Continue with the analytical guide

Sources and example notes

The numbers and curves are teaching examples, not product-batch test results. Sources checked on 11 October 2026.

AI-assisted writing and source review. Catalog materials are for research, development and manufacturing, not human or veterinary use.

An extra mass-spectrum peak? Check for a sodium adduct first

Another ion peak does not always mean another impurity. Check charge and adduct form before counting different ions of one molecule as separate components.

Are the ions being compared equivalent forms?

In positive-ion mode, a molecule may appear protonated or as a sodium adduct. Hypothetical example: singly charged [M+Na]+ and [M+H]+ ions of the same molecule differ by approximately 21.982 m/z. This is a clue, not structural confirmation by itself.

Divide the difference by two for two charges

For corresponding ions in which sodium replaces one proton while total charge remains 2, the m/z difference is approximately 10.991. Using isotope spacing to assess charge before checking the adduct explanation is more reliable than looking only for an integer difference.

Teaching differences: check adduct form and total charge
Teaching schematic. Numbers are hypothetical examples or explicitly identified study conditions described in the text.

Know when to investigate further

Check accurate mass, isotope pattern, chromatographic position and other charge states for a consistent explanation. Changes after cleaning or sample handling are useful experimental clues to record. A candidate sodium-adduct assignment does not rule out all real impurities.

Original sources and scope

Consult the sources for full methods and results. Teaching examples are not NHD lot-test data.

Related research materials

Ask about materials and documentation

Research materials and experimental education; no instructions for human use.